TFStat - Traffic Flow Statistics
Abstract
Traditionally, researchers who wish to look at traffic flow have one option – Netflow. However, Netflow only allows researchers to get a limited view of the big pictures as the data comes from core routers – it is very difficult to get a view of the network from an end user's perspective. TFStat is a set of tools that solve this problem. TFStat allows researchers to get such data from the vantage point of the end user, and has the added benefit of being compatible with Netflow. This paper will present the 2 major components of TFStat, discuss the implementation, look at some experimental results running the tools, and finally note some areas for future research to expand on the project.
1. Introduction
A useful tool of network researchers and network administrators is one that allows them to view data for the flows that are passing through their networks. The de facto tool that allows them to do so is Netflow, an open network protocol developed by Cisco to collect IP traffic information. Fro a router's point of view, a flow is a set of packets that share the same source IP address, destination IP address, source port, destination port, and IP protocol. Whenever the router determines that a flow is no longer active it will create and store a flow record. This flow record can contain any number of fields – timestamps of the start and end times, number of bytes in the flow, number of bytes in the flow, layer 3 headers, version numbers, and a number of other options that are well documented in various Netflow documents [1].
Netflow is run on Cisco enabled devices, and these have the property of generally sitting in the core of networks rather than on the edges by users. This means that the Netflow data that is available to researchers tends to be from the point of view of the network at large, rather than of an end user. If one end user, or a number of end users, are reporting troubles of some form, Netflow is very unlikely to be able to allow the operator to diagnose the problem.
Similarly, the end user themselves has no easy to use tool to see what sort of traffic is entering and leaving their computer. Tools do exist, but without extensive network knowledge can be nearly impossible to decipher the data collected. Wireshark is a prime example of this, and that is an easy to install and run tool, but ask any non-computer scientist to tell you the meaning to a capture in the tool, and you will get a blank stare. A need exists for a tool that end users can easily install and run, and that will present the data captured in an easy to understand and read format.
To fill this need, a set of tools collectively called Traffic Flow Statistics (TFStat) has been created that will both allow network researchers to see flows from a users point of view and provide the end users with easy to understand visualizations of the network activity and allow them to understand their Internet trends. The two main components to this set of tools are a cross-platform host based flow collection and reporting tool, and a central collection and reporting server. Both these tools are easy to install, cross platform, and have very few dependencies.
The remainder of the paper is organized as follows: Section 2 describes the implementation details of the two components for the tool, as well as some of the issues that occurred while developing the tools. Section 3 describes some experimental results from running the tool for an extended period of time. Section 4 describes some additional work and research that can be completed to enhance the features and usefulness of the tool. Section 5 documents the conclusions drawn from this project.
2. Implementation Details
TFStat has two major components: a host based collection and reporting tool, and a central collection and reporting server.
2.1 Reporting Tool
The reporting component is a host-based flow collection and reporting tool. The tool is cross-platform (see section 4 for a note involving this) and has been successfully tested and run on Linux, OSX, and Windows machines. The reason for its ability to be cross-platform is that it only has two dependencies: libpcap and 3 perl modules. Both perl and libpcap are very widely ported applications and should be available on almost any platform, so it is likely that the application will run on many others than the 3 platforms it has been successfully tested on. See Appendix A for instructions on how to set the reporting tool up.
The tool utilizes an XML configuration file to allow users configure some of the different options available to them. The Identifier field is the username for the system. The CollectionPassword field is used to authenticate the username when reporting flows. The CollectionURL field is the address and page that the collection server is listening on. The NetDevice is the network device that libpcap will listen and parse packets for. Finally, a number of Rule options can be defined in the configuration file. Rules have 3 different parameters: remote_ip, remote_port, and ipproto. Once a rule has been defined, the tool will not report any flows that match the rule. The default configuration file comes with a rule to ignore the IP address the collection server is sitting on. If this rule is not in place, when the reporting tool reports the flows, a new flow will be created for the communication with the collection server. This will result in a constant exponential increase in the number of flows reported, so this rule was added to avoid that. In the event that multiple collection servers existed, a user could simply choose their favorite by putting in the new URL and page in the configuration file. The functionality could also be expanded to allow reporting to multiple collection servers if the need arose for that feature.
The reporting tool itself is a multi-threaded perl daemon. One thread is created for getting the packets off the network and adding them to a hash table. Another thread checks for expired flows, and a third thread exists for reporting expired flows using http get requests to the collection server. Some issues encountered when converting the application to be multi-threaded will be addressed in section 2.3.
The thread to capture and store packets works by utilizing libpcap and listening to whatever interface was defined in the configuration file. As packets pass by, libpcap grabs each packet and hands them off to the TFStat. The tool then hashes the tuple of the source ip, destination ip, source port, destination port, and ip protocol, as well as making note of the byte and packet count of the flow. This hash is then looked up in the hash table, where the byte and packet count are stored along with a timestamp of the time the packet was seen.
A second thread exists to do garbage collection and check for any flows that have expired. The flow expiration time is configurable and is a variable defined at the top of the perl file (by default, it is 20 minutes), so the user can easily change it to meet their needs. When the thread notices a flow has expired, it launches a new reporting thread.
The reporting thread takes all the information about the flow and sends a http get request to the collection server location defined in the configuration file. There is currently no error checking to see if the request was successful or not. Upon sending the request, the thread detaches.
2.2 Collection Server
The collection server is implemented using PHP and MySQL. These are the only requirements the collection server has, so, much like the reporting tool, it is possible to implement it on almost any system that exists today. No special extensions or configuration of PHP or MySQL are needed – the basic installations are all that is needed.
The server listens for flows as http get requests. The flow records are passed as parameters on these requests. The current parameters are the flow record, Identifier, and CollectionPassword. Upon getting a request, the collection server performs an MD5 hash on the collection password and compares it with the hash stored in the database for that identifier (user name). If they match, some basic error checking and parsing is done on the flow parameter and it is then stored in the database and associated with that user's identifier. If the authentication failed the server doesn't store the flow record, and also provides no message back to notifying them of the failure.
Once a user has reported some flows, they can log onto the collection server to view visualizations of their flow data that have been created. These graphs are created using the PHP/SWF Charts tool, and they create visualizations to allow the users or researchers to quickly detect anomalies and other trends in normal traffic patterns.
On the site, a user can log in to view graphs for their reported flows only. When not logged in, users are presented with graphs that aggregate information for all users' flows. A logged in user can access a configuration page to modify settings for their graphs. The first option is to change the number of columns shown on the graphs – the default is 10. The second field is to allow users to enter all the IP addresses that they have run the tool on. This allows the collection server to create graphs that differentiate between incoming and outgoing traffic, as well as allowing it to ignore any spoofed traffic that get sent out over the wire. If the user's IP addresses are not entered, it is likely that the first few columns on the graph will be all the traffic from that user's IP address and will limit the usefulness that can be gleaned from observing the graphs. The final configuration option is a checkbox to ignore broadcast traffic or not. This allows the user to focus explicitly on traffic to or from them. A user is not able to configure the actual broadcast IPs to ignore, they only have a choice to ignore those entered by administrators or not.
The first choice a user has when viewing the graphs is which category of graphs to view. They can enable or disable the views as they please. The categories are All Traffic, Incoming Traffic, Outgoing Traffic, and Broadcast or Spoofed Traffic. The All Traffic graph displays graphs for all flows the user has reported. The Incoming Traffic graph displays graphs for the flows that have a destination address of one of the IPs configured by the user. The Outgoing Traffic graph displays graphs for flows that have a source address of one of the user's IPs. The broadcast or spoofed graph shows all flows where neither the source or destination address was one of the addresses entered by the user. However, if the ignore broadcast flag is set, the pre-configured broadcast addresses will not be displayed in this graph.
There are currently 8 different classes of graphs that a user can view. They are: Number of Packets or Bytes, Bytes or Packets per IP Protocol, Bytes or Packets per Port using TCP, Bytes or Packets per Port using UDP, Number of flows based on flow size, Number of flows based on flow length, and bandwidth graphs. For almost all the graphs, it is possible to click on the IP address to view all flow records for that IP in appropriate category.
The Number of Packets/Bytes Graph displays the top IPs that have been communicating, sorted by either packet count or byte count. The Protocol comparison shows byte and packet counts for all of the different IP protocols. Clicking a link takes you to a graph for each protocol, and this graph is displayed according to the byte count of each IP that communicated using this protocol. The TCP and UDP Port graph show the ports with the top byte or packet count. Similar to the Protocol comparison, one can click a link to view the top IPs that used each port. The flow size graph shows the number of flow that were within a certain byte size. One can click a link for each time frame to view a printout of all flows that match that time frame. The Flow Time graph shows the number of flows that lasted within a certain length of time. Finally, the bandwidth graph shows the bandwidth of flows for the past hour, 6 hours, 12 hours, and the past 3 days.
2.3 Implementation Issues
Several implementation issues occurred during the process of creating this tool. A major one involved perl and its memory handling. When a value is removed from the hash table, the memory associated with the value is freed but the memory associated with the actual address isn't freed by perl. This means that when lots of flows are being tracked and reported, the memory footprint of the program will continually expand which is obviously inappropriate for a tool designed to run for extended periods of time. Due to this, every time the tool checks for expired flows, it also creates a new hash table and copies all the current keys to the new table, after the expired flows have been removed. This removes the memory imprint from expired flows, and cuts down on the memory usage by the tool (without adding much computational load).
Additionally, using locking between the threads caused some initial hardship while running the tool. The hash table has to be shared between threads, as all the flows get reported to the same hash table. However, locking the whole data table could lead to some packets not getting recorded if they expire very close in time and the data table was locked by another thread reporting a different flow. Experimentation has shown that libpcap will typically queue up enough packets to allow for expired flow detection to run and then process the new packets without any packet loss. There is also a finite number of threads that can be handled by systems. This varies by system, so we have made the limit of the number of threads TFstat attempts to run a configurable option. Each thread is reported in its own thread, so we track the number of threads currently running and block new threads from being spawned until a reasonable number of “free” slots open. Currently we default to limiting the number of running threads to 20.
The original implementation of the tool distributed for beta testing had nested perl hash tables in order to store the tuples and flow data. However, as the number of flows increased it became evident that this was a major bottleneck for the performance of TFStat. We found that using an MD5 hash of the 5-tuple (source IP address, destination IP address, source port, destination port, and IP protocol) as the hash function in one has table is a much faster operation when doing a lookup than nested hash tables. This allows the tool to handle a higher amount of traffic passing on the wire and being captured by the tool.
Finally, as mentioned earlier, if the IP address of the collection server is not filtered in the configuration file, this will lead to a constant exponential growth in the number of flows reported, and will cause the graphs created by the collection server to be skewed and might lead one to misinterpret the results.
3. Results
In general, the results discovered from these graphs show that this is a very easy and quick way to determine what sort of traffic is occurring on ones host. The authors had hypothesized that this might be the case, but after actually seeing the graphs, it was realized that this was a more powerful tool than originally thought. It provides the ability for a user on one screen to quickly scroll through a list of the graphs, and if they are accustomed to what trends they should be seeing, can provide them a quick gage as to the if the traffic coming to and from their host is behaving as expected.
The first result this study discovered was an exercise in human psychology rather than networking: users will not participate in studies without very strong incentives or being compelled to participate so in some way. TFStat was sent to a pool of about 25 people with a request to run it for the purpose of aggregating data and pulling some results from it, however, none of the people sent any data back or indicated they ran or even tried to install the tool.
It was discovered that while the packet count for certain ports was comparable for packets in versus packets out, the byte count was strongly disproportionate. Figure 1 displays the byte count for http traffic (port 80). The number of bytes coming from the web server with the IP address of 216.165.129.135 was around 210.1 million. The number of bytes sent to that host was only 4.6 million.
Figure 1: Differences in byte count for port 80. Top graph displays incoming traffic. Bottom graph displays outgoing traffic.
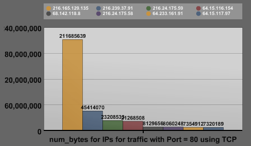

This is almost a difference of 50 times between the amount of traffic sent and received to that one host. The disproportionate ratio between incoming and outgoing bytes on a port-by-port basis can be seen for many other ports as well.
Although this makes sense, given that traffic to the web server might have mostly consisted of GET requests, with the response containing a large number of graphics and other large data objects, it is interesting to see concrete results and visualizations on this. An additional graph could be created to display the two byte counts on the same graph with the same scale, and this would provide an even more convincing visual display of the data.
Another interesting result manifests itself in the flow size graph. The graphs for both incoming and outgoing traffic are very similar, as one might expect. The largest number of flows are for the smaller flow sizes, such as 0-1000 bytes and 1000-2000 bytes. However, the broadcast traffic graph looks very different. The largest number of flows is seen in the 2000-4000 byte range with 1913 flows, with there only being 42 flows of size 0-1000 bytes and 0 of the size 1000-2000 bytes.
Figure 2 shows the differences in the incoming versus spoofed IP address.
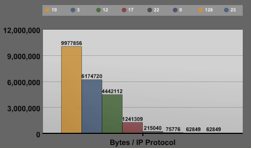
A theory that requires further research is the possibility of detecting good versus bad traffic based on the IP protocol seen in the packets. The graphs created show that only 3 different IP protocols were seen that had IP addresses destined for the host. However, on all the other traffic seen, 7 other unique IP protocols were seen, in addition to protocol 17, which was seen on both graphs. Figure 3 displays these graphs. Future research into this specific phenomena might identify some trend that could help to identify these packets to be dropped at a router in front of the host. It is also possible that gathering more data from more users could indicate this is a phenomena specific to the one user whose data is being displayed, and no such trend exists for a large number of users.
The combination of the protocol and port graphs present a good utility for determining if any unknown services are running on the host, which could help a user determine if their computer has been infected with a virus or not. A user can very easily browse down the list of ports that their host has been sending traffic on as well as receiving traffic on. If they see a port they are sure they don't have a service running on, they can do further investigation about this port. The graphs and legend at the top give a very easy way to gage the number of packets or bytes this unusual port might be sending as well.
Figure 2: Difference in graph structure for number of flows / flow size (in bytes). Top graph displays incoming traffic. Bottom graph displays spoofed traffic.


Figure 3: Top graph displays the number of bytes / IP protocol for incoming traffic, while the bottom graph shows bytes / IP protocol for spoofed traffic.

Finally, the ability that from every graph (with the current exception of the bandwidth graphs) a user can view the flow records from the database for the graph in question within one or two clicks provided to be a very useful tool. Obviously, this was very helpful in debugging the creation of the collection server graphs. More so than that, there were a few situations where there was some question about some of the traffic that had come from for a particular protocol. After clicking on the IP address generating the offending traffic, it was very quickly apparent what that traffic was and that it was indeed supposed to be occurring. This ability will enable other users to perform the same analysis. If this ability was not readily available on the tool, it would take a much longer time to determine what this traffic was, especially if it did not occur again.
4 Future Work
There are a number of areas that could be looked into for future enhancements of the TFStat tool. The first is to add additional ways for the collection tool to report flows to the collection server. The most obvious way is that since the tool is compatible with Netflow, to expand TFStat to communicate with the server using UDP Netflow packets.
Another area to look into is reducing the number of flow report requests. Currently, every flow is reported with a separate http-get request, even if they are evicted during the same garbage collection run. An enhancement would be to combine multiple flow record reports into a single http get request. This would result in both lower http overhead and ease compatibility with Netflow. Over a 5 minute period, there were over 100 hits to the collection server reporting data for only one user. Obviously, as the system scales and more users begin to use this tool this will soon become too high of a load for the server to handle, so some alternative approach, such as the one described above, will have to be taken.
Currently, no testing is done for checking the IP address the host running the collection tool currently has. This is the reason the configuration screen for the collection server has a section for the user to manually insert the IP addresses that have been used. For a customer with dialup or someone without a always-on connection, this could be problematic as their IP address could change every time they connected. Due to this, the code of TFStat could be extended to check the IP address of the host every hour or so, and send a message to the collection server to store the IP address and associate it with the user. There are some technical difficulties in implementing this. After attempting to do so, we discovered there is no easily implementable cross platform solution to do this. We could have done different sections of code for different platforms, but as the rest of the code is currently platform independent, we didn't feel like adding that feature and thus having to have different versions for each platform. Hopefully with some more research a solution to this problem with present itself.
Additional work is also needed to optimize the performance of the generation of the graphs. When there were originally only around 4 graphs and only a days worth of data the graphs would display immediately. However, some of the default timeout values of the chart software have been increased due to occasional timeout errors. For one user over the past 12 days, over 70,000 records have been generated. As the number of users begin to scale the number of rows contained in the database will greatly grow, so some care will need to be made that all the database queries can effectively handle parsing such large sets of data in a short amount of time such that the charting software does not begin to time out.
Another enhancement that could be made involves the collection servers. The code could be easily expanded to allow a user to send flow data to multiple servers. Alternatively, code could be added on the collection tool to check to make sure the collection server got the data. If the flow was for some reason not recorded or the server was down, a backup collection server specified in the configuration file could then be used. This would also involve changing code on the collection server to send back a response on an error.
In order to provide an easier to use interface for the user, a GUI application could be built over the XML configuration file for the collection tool. Such a tool might allow the user to enter in a website name rather than IP address, and have the GUI do the DNS lookup and store the correct IP address in the XML file for the user.
One final area that is worth looking into is to capture more of the same features that Netflow does. Since TFStat is compatible with Netflow, it makes sense to get as much of the same data as Netflow does as possible. Some of this data includes sampled Netflow, tcp options, and a vast amount of other data. This could further enhance the benefits of this tool for researchers if the information they had for end users was the same data they had from routers in the center of the network.
5 Conclusion
TFStat is a set of tools that will allow network researchers to get flow statistics from the view of the end user, rather than from the center of the network as most of the data collected is. Additionally, the graphs and reporting process provide an easy way for end users to see some monitor their network usage and determine what hosts they are communicating with. This could be very helpful in allowing a user to detect if they have been infected with a virus or worm and their computer is now silently communicating with hosts over the network or phoning home. Once configured with the initial rules, the operation of TFStat is completely hands free and can be run in the background without requiring any additional input from the user. The framework that creates the graphs is very extensible and as users or researchers desire more graphs to show different information, it will be a simple addition to create the graphs showing the information they want.
6 References
[1] http://en.wikipedia.org/wiki/Netflow
APPENDIX A – Installation of TFStat collection and reporting tool
Step 0: Linux / OSX only
You must be root to install these tools and do the packet captures
Step 1: Make sure your system has multithreaded perl on it.
OSX: It has it already Linux: Likely installed (may not be multithreaded. Consult your OS documentation for instructions) Windows: get active state perl and install it: x86: ActivePerl-5.8.8.820-MSWin32-x86-274739.msi AMD64: ActivePerl-5.8.8.820-MSWin32-x64-274739.msi
Step 2: Make sure your system has libpcap on it.
OSX: It has it already Linux: likely installed, if not, on Gentoo: "emerge libpcap", on RHEL: "up2date libpcap", other versions, see your OS vendor Windows: Install WinPCap: WinPcap_4_0.exe
Step 3: Get all required perl dependencies
All Platforms. You may either use your platform’s package manager (portage/ports/etc) to install the extra packages, or do things utilizing ppm and CPAN. For ppm/CPAN: from a command line shell (terminal or dos) run:
ppm install http://www.bribes.org/perl/ppm/Net-Pcap.ppd
perl -MCPAN -eshell
Once inside the CPAN shell, (do the configuration if required, defaults are pretty much ok), run:
install NetPacket::EthernetYou may need to install the following packages in the same way you installed NetPacket::Ethernet: XML::Simple LWP::Simple Digest:MD5 Windows Users: If you get an error message not having nmake installed, do the following steps: Download nmake: nmake15.exe Copy the file to your perl bin directory, typically C:\Perl\bin Double click the file nmake15.exe (or run it from the command line) to install nmake
Step 4: Figure out what network device you want to use
OSX: ifconfig will list them. Usually wired is en0 and wireless is en1 Linux: ifconfig will list them. Likely eth0 Windows: Windows is difficult. The default device is dialup, and the other ones have crazy names. The easiest way we found is to download WinDump.exe and run it with parameters like "WinDump.exe -i1" and 2,3 etc. 1 will be the default dialup adapter and your order may vary but on my vmware installation of Windows XP, 2 is the wired ethernet adapter. You can get WinDump.exe here: WinDump.exe.
Step 5: Check TFstat configuration.
On OSX / Linux, make sure the file is executable:
chmod +x tfstat_capture.plMake sure the information is right in your configuration file. It should look something like this:
<?xml version='1.0'?>
<options>
        <option name="identifier"  value="myname" />
        <option name="collectionurl"
value="sixstringmedia.com/cs7260/report.php" />
        <option name="collectionpassword" value="secret" />
        <option name="netdevice" value="eth0" />
        <option name="rule" remote_ip="128.61.49.109"
 remote_port="80" ipproto="6" />
        <option name="rule" remote_ip="216.24.175.58"
remote_port="22" ipproto="17" />
<option name="rule" remote_ip="127.0.0.1" remote_port="123232" ipproto="7" />
</options>
Step 6: Run it!
On all platforms, fire up a shell and type it i n . Examples: OSX: `./tfstat_capture.pl` Linux: `./tfstat_capture.pl` Windows: `tfstat_capture.pl` When you're done running it, just send it a stop signal and wait for it to report all the flows that it has seen. NOTE: on windows, after ctrl-c ing the process, you'll need to send some more TCP packets through the interface before the program will exit, so hit ctrl-c.