Pulse for Cash-Flow Mangement
A long time ago I signed up for Pulse for managing cashflow for ithought. It was kindof neat, but wasn't much of anything that I couldn't just do in a spreadsheet, so I pretty mugh forgot about it. This past Tuesday, they emailed me to let me know about a new version with lots of fancy graphs, and (as you may know) I'm a sucker for fancy graphs, so I loaded all of my cashflow information back in and signed up for the paid version which gives me a 30 day free trial to play with all the extra features.
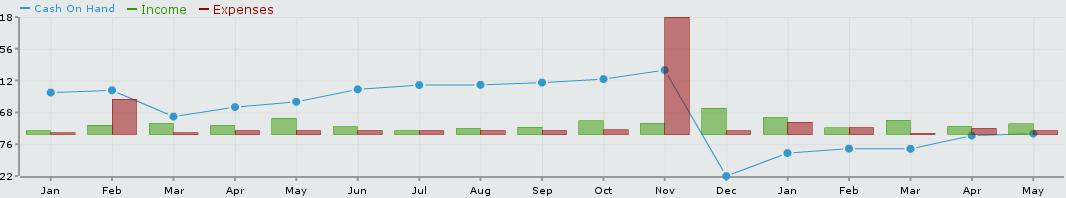 the bottom of the bar graph bars is at the 0 line on the scale for the blue line which represents cash on hand. Anything below the bars is negative cash on hand.
The new graphing functionality is pretty nice. For any time range, it's possibile to get pie charts for showing breakdown by category of income and expenses. It's also possible to show a "cash on hand" graph over a time range that presents cash on hand every month, as well as income and expense totals for the month. It sure beats using the spreadsheet I have (though it will export your data into a csv file) , but is it worth the $9/month or more?
Unfortunately, my list of negative things is longer than my positive ones:
the bottom of the bar graph bars is at the 0 line on the scale for the blue line which represents cash on hand. Anything below the bars is negative cash on hand.
The new graphing functionality is pretty nice. For any time range, it's possibile to get pie charts for showing breakdown by category of income and expenses. It's also possible to show a "cash on hand" graph over a time range that presents cash on hand every month, as well as income and expense totals for the month. It sure beats using the spreadsheet I have (though it will export your data into a csv file) , but is it worth the $9/month or more?
Unfortunately, my list of negative things is longer than my positive ones:
- It would be nice if cash flow view had net in/out row in addition to cash on hand, perhaps color coded? As it is, I have to manually compare this months cash on hand to last months cash on hand, using raw data from a report or the cash flow page. I'd think that net gain/loss for the month would be prominently displayed.
- It's goofy that "add expense" has a - icon next to it. I associate that icon with deleting something, and have never seen it used this way.
- It's a little pricy. For a business that doesn't 'make' any money (I try and break even on income/expenses), $108 for a year of graphs that I could really make in Open Office is a little steep, and the free version is crippled witout any reporting functionality at all. Not even a basic graph with a non-customizeable timeline?
- The user interface isn't as snappy as other web based applications.
- The way that companies are organized is kind of weird for an organization like mine. Perhaps someone familiar with Basecamp (which Pulse imports from) can enlighten me on the "Right Way" to do this, but It seems like I'd have to create separate "projects" for each of my hosting clients to get that to show up, and each "project" would only have one income entry.
- While I know that modeling future revenue is hard, I know when I'm going to invoice people, but I want to keep all their payments under one income entry. Pulse only allows entire income entries to be marked as active or inactive, and there is no way to mark individual transactions as inactive while leaving old ones as active. This effectively prevents me from being able to use Pulse to see what my numbers will look like 6 months from now.
All that said, I do like Pulse, but it's been a long time since their last update and I don't know what the timeline for future updates is. This is a service I'd pay for if it let me do everything I needed, and adding a tiny bit of basic client management (just names and contact info) and basic invoice management (just reminders to send invoices for $X on a certain day and reminders to follow up on people that haven't paid) would make this worth significantly more to me.
The graphs are great, and gave me some insights about my business that I somewhat knew but had never seen visualized on my cashflow data. Pulse helped me realize that since January 2006:
- Getting new clients is a slow but steady process, but revenue slowly rises from one several-month-span to the next.
- 40% of my income comes from yearly web hosting, and my monthly hosting customers, advertising revenue, fastermustache related things, and web design projects bring in higher percentages than expected.
- ithought was cash negative after the initial outlay for first server for a year, but then started climbing. These days, I typically build cash reserves before most purchases that fully cover them. The last major purchase was an exception, but should last for some time and pay for itself over less than 2 years. You can see the sudden drop into negative cash-on-hand in the graph above.
- As of May 2009, I'm cash positive $88.41 since Jan 1 2006 in this venture, so my "I spend all the money I make on hardware upgrades and services" still holds true. This year looks like it's going to be a fantastic year of growth for ithought so there should be some very cool hardware on the way before this time next year!
Perhaps Pulse will keep improving over the next few months (like mint.com has), or perhaps it will be years before the next update. I'll keep using it for a month or two and see if the graphs are worth it as revenue comes in and I can see them change, but I could always just spend a weekend with a spreadsheet tool and come up with my own system. Getting the issues above addressed will be key to keeping me on as a paying customer!
comments powered by